
Absolute and Relative Speed Thresholds in External Workload Control
In the pursuit of key insights that better explain the performance of elite athletes, we often ponder which speed thresholds are better– absolute thresholds or relative thresholds?
These insights allow us to understand the physical demands of a game, training session or task. Both thresholds set intervals to obtain the number of times a player is in a particular performance zone, with metrics like distance covered during that threshold zone, and they layer in the amount of time a player stays in the same zone. But it’s important to understand some of the advantages and disadvantages of absolute and relative thresholds to find key performance differentiators.
Let’s first examine what context both provide for us to better understand their contextual significance in performance analysis.
Absolute Thresholds
Absolute thresholds measure the effort of all players equally, based on a fixed threshold as well as a common threshold. For example, the variable High Speed Running (HSR) sets the speed threshold at 21 km/h. The variable Sprint sets a speed threshold of 24 km/h. The absolute threshold sets a specific variable for measuring performance against.
The usage of the absolute speed threshold to measure the performance of an athlete since physical performance is mostly measured in absolute factors– player X ran Y km/h. Thus, the faster football player usually gets the foot on the ball against an opponent. Therefore, the physical performance of an athlete within a task or a training session is usually measured based on these types of thresholds. You can then compare between players, teams and competitions according to these thresholds.
However these thresholds do not consider the maximum capacities of a player. Furthermore, it tends to display higher values in faster players and lower values in slower players– you would infer that players with higher threshold values would suffer more fatigue than others with lower values. That may not be the case. In order to prevent a misinterpretation of the data, we turn to relative thresholds to further examine our data set to better understand true performance.
Relative Thresholds
Relative Thresholds measure the physical performance of players by establishing threshold values that adapt to the physiological conditions of each player. These thresholds are usually established according to a percentage of the maximum speed (p.e 95%), and these can be set according to ventilator thresholds, as well as maximal oxygen uptake (VO2max) values.
Relative thresholds match the intensity threshold between players with unalike values of maximum speed. Say player A, with a high speed threshold of 33 km/h, is being compared to player B, with a high speed threshold of 27 km/h. Player A will reach 24 km/h with a lower relative effort (72% against 89% relative intensity of player B). If the value is set at 80% of the maximum speed, player A should run above 26.4 km/h and player B should run above 21.6 km/h. The relative threshold does not imply the same level of effort by each player.
With relative thresholds, we are able to make data-informed decisions related to the identification of high intensity efforts of all players.
Let’s look at an example, and apply what we learned.
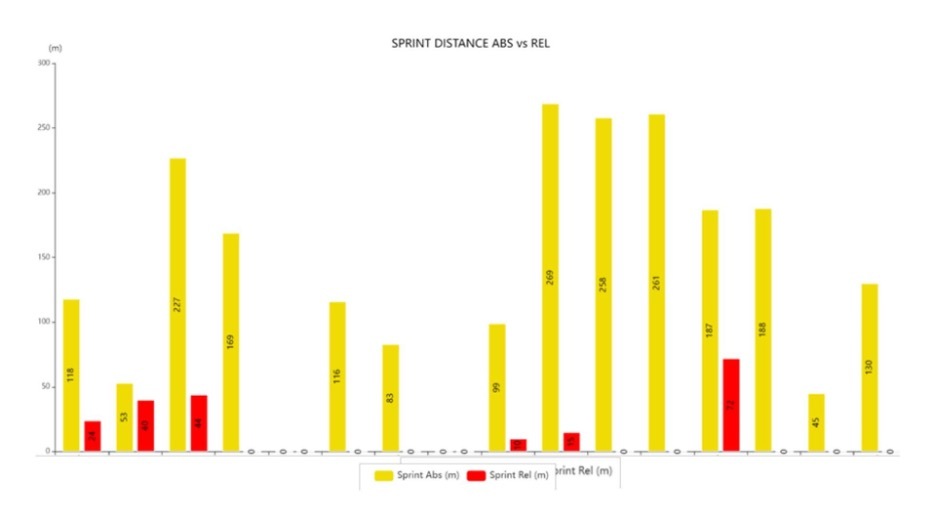
This bar graph displays some real data comparing Sprint absolute thresholds (> 24 km/h) and relative thresholds (> 95%) in training sessions. We will just display the yellow bars (Absolute Thresholds). We observe that some players have a higher volume of sprint-distance than others. What players have covered more distance at a high intensity sprint based on this information?
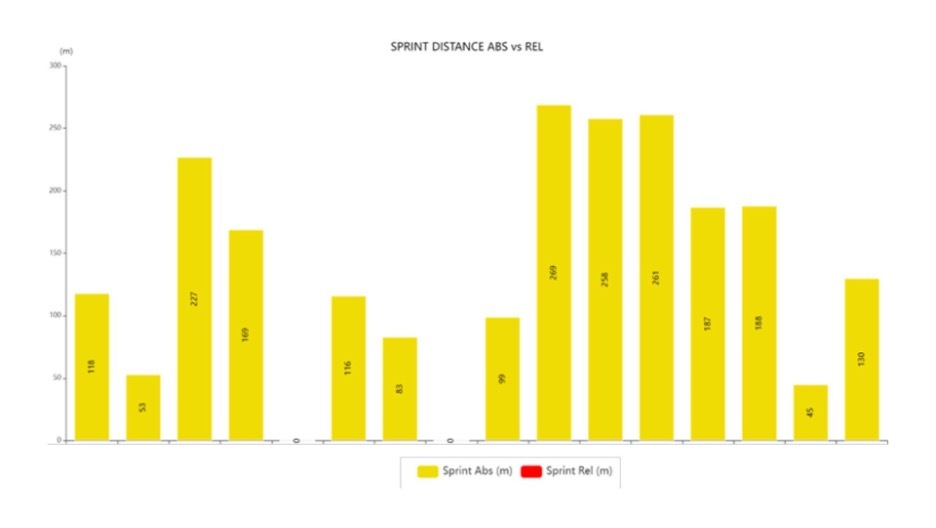
Looking at the absolute thresholds, we can clearly identify those players that have covered 269m, 261m and 258m. But, as mentioned previously, it may lead to wrong conclusions.
Now look at the second bar graph, where relative values are shown (> 95%). We observe the data of the same three players. Just one of them was close to the maximum speed and other players, who weren’t initially a subject in this variable, have covered more distance in terms of relative thresholds.
What is the importance of detecting high intensity performance effectively?
Exposure of athletes to maximum speed efforts during training sessions is a key element for game preparation from a performance point of view, as well as the physical injuries one (Malone et al., 2018). Reaching above 85% of the maximum speed could prompt a protector effect that minimizes the physical injury risk (i.e. hamstrings) (Colby et al., 2018). Thus, if the exposure is low (< 5) and high (>10) the injury risk may increase; otherwise if the exposure is between 6 and 10 over 4 weeks, it may be an optimal stimulus that reduces the possibility of injury (Colby et al., 2018).
Therefore, using Relative Thresholds allows us to identify the physical efforts with a higher precision, which allows us to control the exposure of athletes to high speeds according to their individual capacities. You only need to individually establish a maximum speed value that approaches the real maximum speed for each athlete. This value can be obtained by performing a speed test or simply carrying on related tasks or drills that involve reaching maximum speed.
Proper interpretation of the data is possible if we know the performance variables implied. This will enable us to really know what we are measuring so we make the proper conclusions to make data informed decisions within the training sessions or micro-cycles.
Bibliography:
Colby, M. J., Dawson, B., Peeling, P., Heasman, J., Rogalski, B., Drew, M. K., & Stares, J. (2018). Improvement of Prediction of Noncontact Injury in Elite Australian Footballers With Repeated Exposure to Established High-Risk Workload Scenarios.International Journal of Sports Physiology and Performance, 13(9), 1130–1135. https://doi.org/10.1123/IJSPP....
De Hoyo, M., 2021. El control de la carga en el futbol profesional .
Available at:https://youtu.be/r0Yn9AE_Qes
Malone, S., Owen, A., Mendes, B., Hughes, B., Collins, K., & Gabbett, T. J. (2018). High-speed running and sprinting as an injury risk factor in soccer: Can well-developed physical qualities reduce the risk? Journal of Science and Medicine in Sport, 21(3), 257–262. https://doi.org/10.1016/j.jsams.2017.05.016
Original Unedited:
We frequently wonder which speed thresholds are better if absolute thresholds or relative ones in pursuit of the selection of the performance insights that better explain the performance of athletes.
These kind of thresholds set intervals to obtain number of times a player is in the zone, distance covered and the time a player stays in the same zone. Thus, these insights allow to understand the physical demands of a game, training session or a task. Thereupon, some advantages or disadvantages of absolute and relative thresholds are explained within this article:
Absolute Thresholds
What do we refer to when we talk about absolute threshold? Absolute thresholds measure the effort of all players equally based on a fixed threshold as well as a common threshold. The variable called High Speed Running (HSR) sets the speed threshold in 21 km/h or the variables named Sprint sets a speed threshold in 24 km/h. Both of them are just a couple of examples to depict these type of thresholds.
The usage of the absolute speed threshold to measure the performance of an athlete is feasible ever since physical performance is mostly given by absolute factors. Thus, the faster football player usually gets the foot on the ball before the rival. Therefore, the physical performance of an athlete within a task or a training session is usually measured based on these type of thresholds. Likewise, a comparison between players, teams and competitions can be carried on according to these thresholds.
Nevertheless, if we want to know the stimulus generated by a particular task, these thresholds do not consider the maximum capacities of a player. What’s more, it tends to display higher values in faster players and lower values in slower players. Thus, we have to note this inconvenience in order to prevent a misinterpretation of the data providing incorrect data such as players with highest values would be suffer more fatigue that others with lower values. Therefore, the relative thresholds were coined to prevent these inconveniences.
Relative Thresholds
The Relative Thresholds measure the physical performance of players by establishing threshold values that adapt to the physiological conditions of each player. These thresholds are usually established according to a percentage of the maximum speed (p.e 95%) but these can be set according to ventilator thresholds as well as maximal oxygen uptake (VO2max) values.
Relative thresholds match the intensity threshold between players with unalike values of maximum speed. A player (Player A) with a high speed of 33 km/h against other player (Player B) with a high speed of 27 km/h will overcome 24 km/h with a lower relative effort (72% against 89% relative intensity of player B). Thus, it does not imply the same level of effort by each one. Otherwise, if the threshold is set in 80% of the maximum speed, the player A should run above 26.4 km/h and the player B should run above 21.6 km/h. Thus, we would be able to take data-informed decisions related to the identification of high intensity efforts of all players.
The next bar graph displays some real data comparing Sprint absolute data (> 24 km/h) and relative data (> 95%) in training sessions. First of all, we will display just the yellow bars (AT). Thus, we observe that some players have higher volume of sprint-distance that others. What players have covered more distance at a high intensity sprint based on this information?
We can clearly identify those players that have covered 269 m, 261 m and 258 m. But, as mentioned previously, it may lead to wrong conclusions. On the other hand, looking at the second bar graph where relative values are shown (> 95%), we observe the data of the same three players. Likewise, just one of them was close to the maximum speed and other players, who weren’t initially a subject in this variable, have covered more distance in terms of relative thresholds.
What is the reason of the interest aroused by the importance of detecting high intensity performance effectively?
Exposure of athletes to maximal speed efforts during training sessions is a key element for game preparation from a performance point of view as well as the physical injuries one (Malone et al., 2018). Reach above 85% of the maximum speed could prompt to a protector effect that minimize the physical injury risk (i.e. hamstrings) (Colby et al., 2018). Thus, if the exposure is low (< 5) and high (> 10) the injury risk may increase otherwise if the exposure is between 6 and 10 over 4 weeks, it may be an optimal stimulus that reduces the possibility of injury (Colby et al., 2018). Therefore, use Relative Thresholds allows us to identify the physical efforts with a higher precision hence we can control the exposure of athletes to high speeds according to their individual capacities.
Consequently, the only challenge is to individually establish a maximum speed value that approaches the real maximum speed of each athlete. Likewise, this value can be obtained by performing a speed test or simply carrying on related tasks or drills that involve reaching maximum speed.
The proper interpretation of the data is possible if we know the performance variables implied. This will enable us to really know what we are measuring hence we obtain proper conclusions in order to take data informed decisions within the next training sessions or micro-cycle.
Bibliography:
Colby, M. J., Dawson, B., Peeling, P., Heasman, J., Rogalski, B., Drew, M. K., & Stares, J. (2018). Improvement of Prediction of Noncontact Injury in Elite Australian Footballers With Repeated Exposure to Established High-Risk Workload Scenarios.International Journal of Sports Physiology and Performance, 13(9), 1130–1135. https://doi.org/10.1123/IJSPP....
De Hoyo, M., 2021. El control de la carga en el futbol profesional .
Available at: <https://youtu.be/r0Yn9AE_Qes>
Malone, S., Owen, A., Mendes, B., Hughes, B., Collins, K., & Gabbett, T. J. (2018). High-speed running and sprinting as an injury risk factor in soccer: Can well-developed physical qualities reduce the risk? Journal of Science and Medicine in Sport, 21(3), 257–262. https://doi.org/10.1016/j.jsam...


